 Enesgy
International Maritime Port Security—
by Claire Apthorp
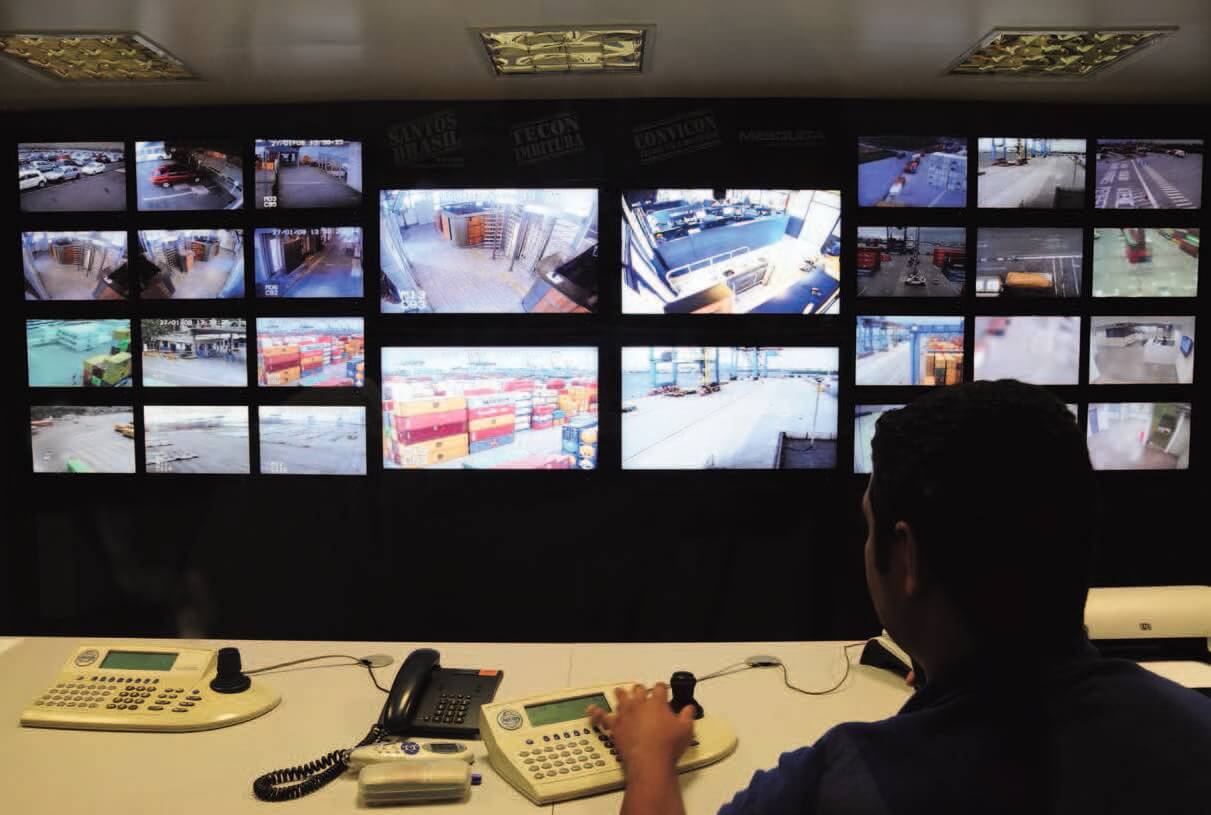 The past two decades have seen a dramatic shift in the spectrum of threats port areas have to deal with to remain secure. In addition to keeping vessels, passengers, employees and cargo within the facility safe from accidents, the authorities must have the means to monitor and protect against the persistent threats of terrorism, smuggling and illegal immigration…
Geographic information systems (GIS) are increasingly being deployed to provide the capability to draw together situation awareness to aid emergency responders in decision-making. GIS allows users to view, understand, visualise and interpret data from multiple sources – CCTV, radar, VTMS, thermal imagers and AIS receivers – into a single operating picture of the facility. Rendering the data visually reveals relationships and patterns to inform decision-making; essentially showing what has happened, what is happening and what will happen in a geographic space.
Such a system has been rolled out at the Port of Los Angeles (POLA) by NorthSouth GIS using an Esri-based enterprise GIS that addresses operational, security and emergency management issues, with data and ready-made maps served directly from an Esri ArcGIS server – a platform for designing and managing solutions through the application of geographic knowledge – to other software and systems including situation management. This provides an integrated display of static GIS data and dynamic data including vessels, traffic, weather and blue force tracking for port police, and delivers and integrates geospatial information via a port-wide intranet GIS web map viewer known as geoPOLA…
Full article and image courtesy of International Maritime Port Security